Diving too carefully?

Ross,

Do you not think it might be time to revise your ideas? I am happy to cop the accusations of deception, trickery, distortion, manipulation, arguing with myself etc etc in the interests of ensuring that the facts are at least available to people. But now we have David (one of, if not the most prominent decompression modeller(s) currently working in the field) and Neal all saying the same thing. You will also have noted the post from Iain Smith, himself a medically qualified scientist. We can't all be involved in deception, trickery and distortion.

What does it take to make you change your view on something? Because to me it is starting to look like you won't change no matter how overwhelming the indications that you should, and that your motive, whatever it is, is not to find the truth as best we can currently define it.

Here are some further complications in the test data we have on hand from the test with dual frequency doppler, and observed intra / extra vascular microbubble. (1).

Just a few posts back you were claiming this paper supported your view; now that it has been pointed out that it doesn't, you are trying to criticise it.

Are we looking at everyday normal dive microbubble growth?? Or the result of a serious injury and breach of protocol?

There is that "normal" word again. There is nothing "normal" about bubbles forming in places they should not be. Leaving that aside, what is your point? You seem to be inferring that there are two different processes for bubble formation; one that occurs when you are within your decompression protocol ("normal" bubbles), and another when you are in "breach of protocol". You further infer that we therefore cannot draw any conclusions about diving within protocol from these "breach of protocol" studys. The overwhelming liklihood is that there are no differences in the mechanisms of bubbling between provocative and non-provocative dives (where "provocative" indicates a breach of protocol), but rather that a provocative dive is more likely to (but not always!) trigger a greater expression of the same process.

With three hours of missed deco, and 20% injury rate, these subject would have been under extreme decompression stress, but 66% of the pigs had a Low VGE. This a clear example showing how using VGE as a stress measure - is not consistent.

No its not. It depends on how you define "decompression stress". You are defining it in terms of compliance with a decompression algorithm, but in fact, the best way to see VGE (and Neal has made a similar point several times) is as a measure of decompression stress in their own right. Forget about your decompression protocol.... if a diver has Grade 4 VGE, that is high decompression stress even if their dive complied with the decompression protocol. Similarly, if a diver has no VGE (on a properly conducted survey) then that is low decompression stress largely irrespective of the dive they have done.

Simon M
 
Last edited:
Simon,

So I point out some technical issues in a paper and study, that makes it more difficult to fully support your theories. Then you go off in a frenzy and give us another round of 'all my science friends' say its right, so it must be. You then deny some of the facts as written, and give us yet another distorted interpretation.

Settle down Simon.

*********

When are you going to publish this new and different overall theory of VGE? It's clearly different to the concepts that other previous scientist and groups have put forward, and many of them have been working on this issue a lot longer, and with more resources, than you have.
 
Last edited:
Hi, Ross,


However, having not attempted to make a diagnosis of DCS in any animal, this study cannot not identify either tissue microbubbles or VGE as the cause of symptomatic DCS.


The question of whether muscle microbubble formation is a normal consequence of correctly executed decompression or only found in the context of inadequate decompression is left open.


Regards,

Iain

Hi Iain,

This is a bit of a problem for us. If the test crosses the threshold of creating a serious injury, and we later take a close look at that injury site, can it be assumed the same damaging events (or severity) were present before the injury?

I'm imagine that problem is an issue for many test design and procedures in all kinds of science.


The information we have so far, has all been collected under the conditions of severe DCS in animals. I wonder how much of this is really present before the injury occurs, as in normal diving?


I submit that making a diagnosis of DCS would have been impossible ..
Iain

Ah.. yes of course. Meaning the real DCS rate would likely be much higher than observed in just skin bends.


******

I'd love to know the answer to these questions and more, but I cannot accept the assumptions we have been given so far. I think these new ideas are too far from established theory at present.
 
Last edited:
This is a bit of a problem for us. If the test crosses the threshold of creating a serious injury, and we later take a close look at that injury site, can it be assumed the same damaging events (or severity) were present before the injury?

I'm imagine that problem is an issue for many test design and procedures in all kinds of science.

Hi, Ross,

It's one of the great problems in medicine. To what extent can evidence from tightly controlled "lab" conditions be extrapolated to the real world, particularly when a phenomenon is observed under non-physiological or provocative conditions. This study used aggressive decompression to generate the bubbles which the researchers needed to have in order to determine whether they could be detected. They have now proved their technique and equipment works and have noticed some interesting patterns in terms of bubble formation and release. Hopefully they will take the work forward, for example, to compare deliberately provocative deco with "limits of normal" decompression and a "well inside the tables" profile, ideally measuring tissue and vascular bubbles during the ascent as well as post-deco. Whether that is actually do-able (without bending the investigators!) is a question of technique and finance.

The information we have so far, has all been collected under the conditions of severe DCS in animals. I wonder how much of this is really present before the injury occurs, as in normal diving?

A perfectly valid question which the authors themselves raise in their discussion.

Ah.. yes of course. Meaning the real DCS rate would likely be much higher than observed in just skin bends.

Probably. But what sort and in which animals? The relationship between tissue microbubbles, VGE and DCS is still to be determined.

I'd love to know the answer to these questions and more, but I cannot accept the assumptions we have been given so far. I think these new ideas are too far from established theory at present.

And that's one of the joys of science. Does new evidence fit with existing theory? If not, is the theory wrong or is was the study which produced the evidence compromised in some critical way. On the other hand, if this study does not implicate tissue micro bubbles as the source of VGE in "real world" diving, then an alternative theory to explain the source of VGE is required which also explains the findings in this extreme case.

Regards,

Iain


Sent from my iPad using Tapatalk
 
So I point out some technical issues in a paper and study, that makes it more difficult to fully support your theories. Then you go off in a frenzy and give us another round of 'all my science friends' say its right, so it must be. You then deny some of the facts as written, and give us yet another distorted interpretation.

If you want to debate this matter you will have to be more specific than that.

When are you going to publish this new and different overall theory of VGE? It's clearly different to the concepts that other previous scientist and groups have put forward, and many of them have been working on this issue a lot longer, and with more resources, than you have.

Apart from the fact that there is nothing new or different about it, take your pick from.

BENNETT MH, MITCHELL SJ. Hyperbaric and Diving Medicine. In: Longo DL, Fauci AS, Kasper DL, Hauser SL, Jameson JL, Loscalzo J (eds). Harrison's Principles of Internal Medicine (19th ed). McGraw Hill, Chapter 477e, 2015

MITCHELL SJ. Decompression sickness pathophysiology. In: Edmonds C, Bennett MH, Lippmann J, Mitchell SJ. Diving and Subaquatic Medicine (5th ed). Saunders, Chapter 10: In press 2015.

SMART D, MITCHELL SJ, WILMSHURST P, TURNER M, BANHAM N. Joint position statement on persistent (patent) foramen ovale and diving. South Pacific Underwater Medicine Society (SPUMS) and the United Kingdom Sports Diving Medical Committee (UKSDMC). Diving Hyperbaric Med. 45, 129-131, 2015.

MITCHELL SJ, DOOLETTE DJ. Pathophysiology of inner ear decompression sickness: potential role of the persistent foramen ovale. Diving Hyperbaric Med 45, 105-110, 2015

VANN RD, BUTLER FK, MITCHELL SJ, MOON RE. Decompression illness. Lancet 377, 153-164, 2011

MITCHELL SJ, BENNETT MH. The pathophysiology and manifestations of decompression illness. In: Fife C, St Leger Dowse M (eds), Women and Pressure. Flagstaff, AZ., Best Publishing Company, 1-26, 2010.

MITCHELL SJ, DOOLETTE DJ. Selective vulnerability of the inner ear to decompression sickness in divers with right to left shunt: the role of tissue gas supersaturation. J Appl Physiol 106, 298-301, 2009

FRANCIS TJR, MITCHELL SJ. Pathophysiology of decompression sickness. In: Bove AA (Ed). Bove and Davis' Diving Medicine (4th ed). London, Saunders Publishing, 165-184, 2004

FRANCIS TJR, MITCHELL SJ. The pathophysiology of decompression sickness. In: Brubakk AO, Neuman TS (Eds). Bennett and Elliott's Physiology and Medicine of Diving (5th ed). London, Harcourt Publishers, 530-556, 2003


I repeat, there is nothing "new" or "different" here. You will find discussion of VGE, risk of DCS, right to left shunting, and in some of the reviews, a full discussion of intravascular and extravascular bubbles. It is all the same as what I have been saying in this thread, I am not aware of any colleagues who dispute it.

You have had the scientific literature on this matter explained to you independently by 3 diving scientists on this thread. The perspectives we are presenting represent the current thinking on this matter. If you think you know of any work that contradicts what we have been saying, then present it and explain what you think it means in relation to the present debate.

rossh said:
I cannot accept the assumptions we have been given so far. I think these new ideas are too far from established theory at present.

Established where? In your head? I can assure you that the message you have been getting from the experts in this thread represents the "established theory". Its in Bennett and Elliott, in Bove, in Edmonds, in Harrisons; where else would you like it to appear in order to be considered "established". It is only you who cannot (or does not want to) see that.

Perhaps you should read David's post again, which ended....

David Doolette said:
I doubt there is a single scientist working in the area of decompression research who does not believe that the sizes and profusions of intravascular and extravascular bubbles are proportional, and that a decompression procedure that results in many VGE also results in many extravascular bubbles


Simon M
 
Last edited:
[...]

review paper by Mollerloken, Brubakk and colleagues that proposes that bubbles form on the vascular endothelium at caveolea. It is important to point out, that this is an untested hypothesis put forward by Alf Brubakk and colleagues - an hypothesis for which there is no evidence.

[...]

There is considerable evidence that bubbles do not form readily in blood, or inside blood vessels.

[...]

Importantly, the authors made simultaneous DFU measurements inside veins and in extravascular tissue, and the dynamics of the intravascular and extravascular microbubbles were the same - i.e. the number of DFU-detected microbubbles in the extravascular part of the tissue and in the venous blood rise and fall at the same time - demonstrating a linkage between the magnitude and time course of extravascular and intravascular bubble formation.

So...

Microbubbles form in the extravascular and intravascular part of tissues alike. But not in blood as such.
And caveolea appear (with various density) on the membrane of most cell types, except red blood cells, platelets and lymphocytes [1] (and also neutrophils) [2] (and also neurons). Not in blood, in other words.

Interesting... Am I getting this right?

Cheers,

Matthieu

Edit: maybe I should have added some references
1. Caveolae (3rd paragraph)
2. Human neutrophils are devoid of the integral membrane protein caveolin
 
Last edited:
So...

Microbubbles form in the extravascular and intravascular part of tissues alike. But not in blood as such.
And caveolea appear (with various density) on the membrane of most cell types, except red blood cells, platelets and lymphocytes [1] (and also neutrophils) [2] (and also neurons). Not in blood, in other words.

Interesting... Am I getting this right?

Cheers,

Matthieu

Edit: maybe I should have added some references
1. Caveolae (3rd paragraph)
2. Human neutrophils are devoid of the integral membrane protein caveolin

Hello Matthieu,

Warning: written in a hurry in an operating room.

Not sure what David is doing at the moment, and so I will present my interpretation of this. He add his perspectives if they differ.

First, just to make sure we are all on the same page in respect of the "geography" of the processes we are discussing, please see the diagram below. It shows a notional tissue with arterial blood supply coming in, a capillary bed, and the veins taking blood away from the tissue.

Tissues and bubbles.jpg

I think we all agree that if the tissue is supersaturated then bubbles can form within the tissue itself as depicted.

In addition, bubbles can also appear in the capillaries and it should be fairly obvious that the formation of these bubbles is driven by the same supersaturated gas as in the tissue. That fact is unaffected by the specific mechanism by which the bubble in the capillary blood form. One possibility is that the bubble are actually tissue bubbles that rupture into the capillary. We know this can happen because it has been photographed (see a few pages back). Another is that bubbles form somewhere on the surface of the cells lining the capillaries. This is where the caveolae thing comes in. These small imperfections on the surface of the cells might provide a place where bubbles can be shielded from the surface tension of the fluid in the blood, and this facilitates their growth. Its just a theory, and one of several about how bubbles might form on cells lining blood vessels. It has no bearing on the fundamental principle that, no matter how the capillary bubbles form, it is all from the same supersaturated gas in the tissue, and the processes of tissue bubbling and bubble formation in the capillaries (which then become VGE) are linked.

I'm sure David would point out, correctly, that the experiment he described does cast some doubt on the process of bubble formation on cells lining blood vessels. Thus in decompressed dead rats bubbles were found in the tissue capillaries but not an isolated section of a downstream larger vein (which at earlier points in this thread was where Ross claimed VGE were forming). This could be interpreted as favoring the bubbles-forming-in-tissue-and-rupturing-into-the-capillary mechanism as David pointed out in his post. But again, irrespective of which mechanism is responsible for bubbles appearing in tissue capillaries (and it could even be both of those described above), the diagram should make it obvious that it is the same supersaturated gas in tissue driving both bubble formation in tissue and capillaries. The two processes are linked. This is not a new theory. It is the way we have always conceived it as happening.

Simon M
 
Last edited:
Hate to bring up something presented pages and ages ago...

But is perhaps the reason that (see the BSAC tables posted etc) divers of yore "got away with" such minimal/aggressive deco is that all their stops were shallow? Although perhaps they were just younger, tougher, and fitter than divers like me...

Since that time people add a little bit of deep stop time ala a Pyle stop and shape their deco with newer models like VPM. That all gets taken to the extreme by the GI3s of the world (with deep stops barely 2 atas off the bottom) and overall profiles in the GF ~5/110 range and while the deco "looks" far more conservative its really not.

Now we're pointing back towards higher and higher GF lows (50+) as actually being more conservative than profiles with all that deep time. At least if you believe 2+ VGE loads to be indicative of substantively increased decompression stress - something virtually everyone on this thread agrees upon.
 
Hi Simon,

I certainly wasn't expecting an answer from Dr Doolette - or yourself. I just had this coincidence I couldn't falsify by myself, and I don't doubt it's occurred to others, so I figured I'd ask the obvious question so somebody who knows about physiology can sort me out. Thanks for taking the time to do that.

Let me assure you we're on the same page with regard to bubble nucleation and tissue supersaturation. In fact, that's part of the idea: if a caveoli is a good nucleation site on the endothelium, it's just as good a nucleation site within the tissues (many authors emphasize the consistency of caveolae geometry). On other cells. Or the same, for what matters: I haven't read anything that suggest a different distribution of caveolae on the capillary facing side of endothelial cells vs the tissue facing facing side (but maybe no one's looked). It would follow that the nucleation process could in fact be the same within tissues and on the surface of capillaries (and while neurons do not appears to have caveolae, astrocytes do).

I'll confess that I wasn't of the opinion that bubbles crossing into capillaries were the major source, but I never pretended to be an expert, so that's that.

That Dr Doolette's study looked at the whole vena cava and not just blood is the obvious problem. But assuming a constant cross section, the ratio of lining cells vs content cell should be 2-3 orders of magnitude higher in capillaries vs big veins, so maybe (maybe!) that's a factor to consider.

Again, I was just wondering.

Thanks,

Matthieu
 
Last edited:
Hey,

Don't blame me for that crap. No one in my camp has ever made such nonsense statements.

Your claim is wrong too.... VPM-B is LONGER than the thing it replaced, up to about 3 hours.

You go down to the GUE / DIR classroom and tell them to straighten out their message - don't try to blame me for their version of understanding or message.

From this it would seem your argument is with ratio deco, so go argue with them and leave us alone.

Ross I dont follow the VPMB is longer by 3 hours bit? What does this relate too?

Specificly on VPMB Vplanner when it was first launched:

ALL the divers who switched to VPMB beleived it to be a more efficient decompresion that would get them out of the water faster.

The general consensus was that Bhulmans profiles over compensated for the helium which is why VPMB had much shorter shallow stops. On this point I beleive you were in suport

Prety much every one I knew diveing VPMB was diveing level 2

If we look at a 45mins at 70m profile with a VR3 I found my best comparison was 35/85GF running Proplanner

If I look at those numbers today running Multideco I get:

70m 45mins 35/85GF 196mins total 27@6m 41@3m Deep stops start at 45m

70m 45mins VPMB2 169mins 20@6 31@3 Deep Stops start at 48m

So dispite the deep stops starting at a simila depth the VPMB2 profile was 27mins shorter

I can't get GF to mimic that on Multideco as it only goes up to 100GF which brings the deco shallow down to 22mins at 6 36mins at 3 and total run time to 176mins so still 20mins shorter than 35/100GF

If we want to get close to a 35/85GF in water time we have to run VPMB on maximum safety setting of level 5 which then gets the in water time to 199mins so 3mins longer than 35/85GF

If we go the other way and match VPMB2 with GFs total in water time we need to be running 85/95Gf which gives me 23mins at 6 and 36mins at 3 but as first stop depth of 33m so dispite the shalow stops starting 12m shalower I am still a few mins longer on the shallow stops


Ratio deco has nothing to do with this this is a pure comparison between VPMB and GF deco

I have raised my concerns about the short shallow stops using VPMB many many times and the general responce is VPMB is more eficient?

How would you explain it?

ATB

Mark
 
Last edited:
If we look at a 45mins at 70m profile with a VR3 I found my best comparison was 35/85GF running Proplanner

If I look at those numbers today running Multideco I get:

70m 45mins 35/85GF 196mins total 27@6m 41@3m Deep stops start at 45m

70m 45mins VPMB2 169mins 20@6 31@3 Deep Stops start at 48m

So dispite the deep stops starting at a simila depth the VPMB2 profile was 27mins shorter

I can't get GF to mimic that on Multideco as it only goes up to 100GF which brings the deco shallow down to 22mins at 6 36mins at 3 and total run time to 176mins so still 20mins shorter than 35/100GF


How would you explain it?

ATB

Mark


You keep doing this same comparison mistake Mark.... Allow me to paraphrase....

You say... take a VPM-B model plan, and then take a ZHL plan and then modify that ZHL plan with GF to try to emulate the VPM-B plan. In the process of adding GF, it has abandoned the concepts of the ZHL model, and overridden the calibrations of the ZHL model. As a result of the morphing of ZHL with GF, it does not align correctly with the VPM-B plan I'm trying to emulate.

To which the answer is - yes. If you distort ZHL so far from its origins, it won't resemble anything.

Now the GF method is a simple way to stretch out a ZHL plan, but do not think its all proportional and valid to the dimensions and tiny difference that you are trying to measure. The GF method code is simple in its design, and does not provide for the level of scrutiny you are asking from it.


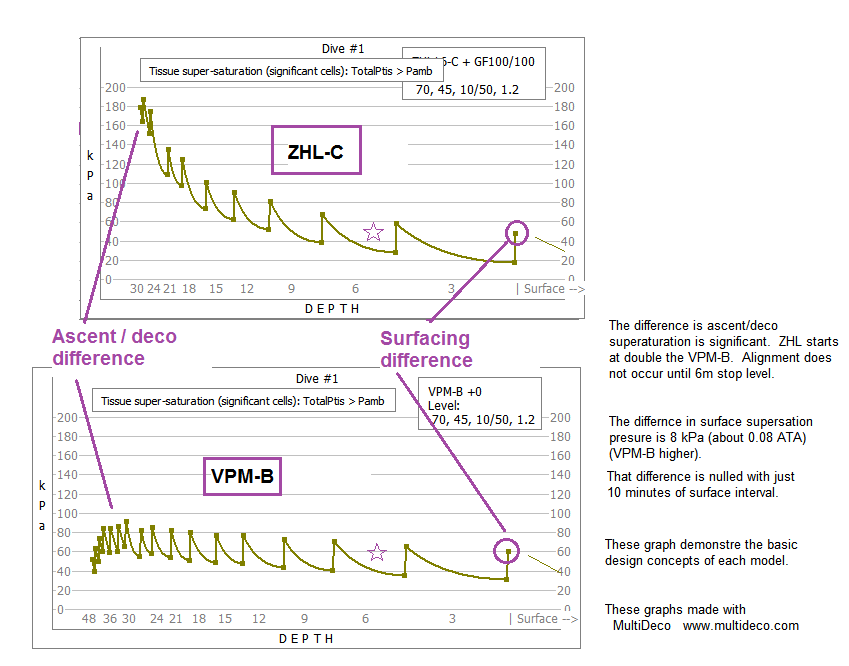
Here is a better way to measure it: supersaturation.

markc_dive.png
 
You keep doing this same comparison mistake Mark.... Allow me to paraphrase....

You say... take a VPM-B model plan, and then take a ZHL plan and then modify that ZHL plan with GF to try to emulate the VPM-B plan. In the process of adding GF, it has abandoned the concepts of the ZHL model, and overridden the calibrations of the ZHL model. As a result of the morphing of ZHL with GF, it does not align correctly with the VPM-B plan I'm trying to emulate.

To which the answer is - yes. If you distort ZHL so far from its origins, it won't resemble anything.

Now the GF method is a simple way to stretch out a ZHL plan, but do not think its all proportional and valid to the dimensions and tiny difference that you are trying to measure. The GF method code is simple in its design, and does not provide for the level of scrutiny you are asking from it.


Here is a better way to measure it: supersaturation.

markc_dive.png

Yet the heat maps posted on an earlier Scubaboard version of this thread (its made the rounds!) show exactly the opposite for a 30 min 60m dive (OC, 18/45 + EAN50 and 100% for deco). Surfacing supersaturation is higher on the VPMB plan vs ZHL 30/85. Which was what the NEDU study was saying with one (air) gas. I don't have Kevin's post/diagrams from that thread saved and its run to hundreds of posts now. Perhaps he'd be willing to repost them here.

Your diagram above is lovely and very elegant. But it doesn't appear to match reality.

You have a peculiar tone implying that the use of GFs is somehow invalidating the ZHL.
 
Last edited:
Your diagram above is lovely and very elegant. But it doesn't appear to match reality.

You have a peculiar tone implying that the use of GFs is somehow invalidating the ZHL.

You are kidding, right??

These are the maximum supersaturation pressures in the tissues, across the ascent. This is how your decompression ascent limits is decided, in both models. MultiDeco has another series of graphs that gives the surface version for several hours too. The MultiDeco program generates graphs for any dive you plan.

GF was invented to reduce the high supersaturation peaks at the start of ZHL plan, and slow down the end a bit. GF is just tacked onto the end of ZHL plan calculation. But if you go far enough with those stretches, you loose contact with where you started and diverge from the underlying model design concepts.

Heat maps and tissue on/off gas graphs that you see normally, is all very colorful, but its 90% worthless noise. The part that is important to divers (as shown in the graph), is the supersaturation.

Download MultiDeco and give it a try - see for your self.
 
Last edited:
Summary of RBW version of this issue
http://www.scubaboard.com/forums/te...-deep-stops-increases-dcs-28.html#post7305072

I also turn your attention to post 260 of that 43 page thread.
http://www.scubaboard.com/forums/te...-deep-stops-increases-dcs-26.html#post7304109

Regardless of whether supersaturation is supposed to be less under VPMB- vs ZHL GF100/100 and which model may or may not more accurately represent reality, nobody actually dives with either of these settings nowadays. Could we all go back to BSAC tables or something like that? Possibly, but when I started deco diving 12 years ago or thereabouts, I was taught that the intermediate deeper stops were actually more important than the shallow stops. Control those deep stops and protect your "fast" spinal cord etc. Blow off the shallow stuff in an emergency. The BSAC tables are exactly the opposite for a given deco time. Times change as well as the definition of conservative.

I don't actually know what your definition of conservative is Ross. You seem to think that VGE are harmless, that deep stop profiles are technically superior and the use of ZHL + GFs is so far away from the parent model as to be useless. Perhaps I have misunderstood. I would really like to know what you think best practices actually are for: 1) defining a level of conservatism, 2) actually matching your profiles with a given definition of conservative and 3) validating that what you think your practices are doing is true with some kind of post-dive marker of decompression stress. If VGE aren't helpful what 'should' be used?

At least what I have learnt over the last 10 to 12 years of being a deco guinea pig is that what people "think" is conservative often isn't. Likewise aggressive isn't necessarily what it appears to be.
 
You keep doing this same comparison mistake Mark.... Allow me to paraphrase....

You say... take a VPM-B model plan, and then take a ZHL plan and then modify that ZHL plan with GF to try to emulate the VPM-B plan. In the process of adding GF, it has abandoned the concepts of the ZHL model, and overridden the calibrations of the ZHL model. As a result of the morphing of ZHL with GF, it does not align correctly with the VPM-B plan I'm trying to emulate.

To which the answer is - yes. If you distort ZHL so far from its origins, it won't resemble anything.

Now the GF method is a simple way to stretch out a ZHL plan, but do not think its all proportional and valid to the dimensions and tiny difference that you are trying to measure. The GF method code is simple in its design, and does not provide for the level of scrutiny you are asking from it.


Here is a better way to measure it: supersaturation.

markc_dive.png


Ross I dont know why you would think it would be surprising to show high GF supersaturation on the deepstops of a 100/100GF dive and then show low supersaturation on a VPMB dive, which by its very nature has deep stops so obviously has low supersaturation numbers for said deep stops.

I also have no understanding of righting off GF decompresion profiles as being too far away from the moddle??? They are what they are they soften the supersaturation phase of decompresion and split the agressive levels into deep and shalow stops.

Your graphs seem quite radical but lets look at 35/85 and VPMB2

GF 35 /85

Super%20Sat%2035-85_zpsfzkdnu4r.jpg


VPMB2

Untitled-4_zpsu6j29upj.jpg


Now we no longer see the agresive supersatuiration deep that you sugest is so bad, in fact the whole prifile seems remarkably similer to me, except the GF verson is eding at 40KPA and the VPB 60KPA?

so how do you justifie 169mins aganst GFs 196?

What is it about the VPMB2 profile that makes it so much better than the 35/85 profile offered in comparison?

ATB

Mark
 
Last edited:
Your diagram above is lovely and very elegant. But it doesn't appear to match reality.

I have no appetite for a further debate on a subject that has occupied 100s of pages on other sites, but rest assured that your observation is correct. Ross's graphs are very difficult to interpret because they don't differentiate tissues, and they don't integrate supersaturation with time across the range of tissues. When you have such analyses (which reveal that deep stops protect fast tissues from supersaturation early in an ascent at the expense of greater supersaturation [integrated with time] in slower tissues later in the ascent) it provides a highly plausible explanation for the greater VGE (and DCS) that have been demonstrated in "deep stop" decompressions in comparative studies. The links you have provided are where people should go for information on this. There is no point in simply restating what has already been said. The seminal threads are at these links:

http://www.rebreatherworld.com/show...-stops-debate-(split-from-ascent-rate-thread)

http://www.rebreatherworld.com/showthread.php?48083-Deep-Stops-(rebreather-dive-charts)

Simon M
 
Ross I dont know why you would think it would be surprising to show high GF supersaturation on the deepstops of a 100/100GF dive and then show low supersaturation on a VPMB dive, which by its very nature has deep stops so obviously has low supersaturation numbers for said deep stops.

I also have no understanding of righting off GF decompresion profiles as being too far away from the moddle??? They are what they are they soften the supersaturation phase of decompresion and split the agressive levels into deep and shalow stops.

Your graphs seem quite radical but lets look at 35/85 and VPMB2

GF 35 /85

Super%20Sat%2035-85_zpsfzkdnu4r.jpg


VPMB2

Untitled-4_zpsu6j29upj.jpg


Now we no longer see the agresive supersatuiration deep that you sugest is so bad, in fact the whole prifile seems remarkably similer to me, except t GFR versin s eding at 40KPA and the VPB 60KPA?

so how do you justifie 169mins aganst GFs 196?

What is it about the VPMB2 profile that makes it so much better than the 35/85 profile offered in comparison?

ATB

Mark

Hi Mark,

You have taken a ZHL plan, and tried to convert it into a VPM-B plan. And as you readily admit, they do not align perfectly. That is correct. GF is good for dramatically changing the ZHL, but why are you surprised that it is not perfect replication tool?

But you make it worse, by saying - my ZHL with conservatism, does not align with VPM-B with conservatism. It never will Mark. You are asking too much of GF.


I'm happy to see you using MultiDeco for supersaturation as an overall measure. Supersaturation is an independent measure.
 
I have no appetite for a further debate on a subject that has occupied 100s of pages on other sites, but rest assured that your observation is correct. Ross's graphs are very difficult to interpret because they don't differentiate tissues, and they don't integrate supersaturation with time across the range of tissues. When you have such analyses (which reveal that deep stops protect fast tissues from supersaturation early in an ascent at the expense of greater supersaturation [integrated with time] in slower tissues later in the ascent) it provides a highly plausible explanation for the greater VGE (and DCS) that have been demonstrated in "deep stop" decompressions in comparative studies. The links you have provided are where people should go for information on this. There is no point in simply restating what has already been said. The seminal threads are at these links:


Simon M


The time and tissue saturation relation is inbuilt to the Schriener and Haldane equations - using a natural logarithm and a half time. These formula fully address any change in any tissue pressures.

For the purposes of your argument, you then take some portion of those tissue values and apply more time value to them. That is an invalid approach. That is counting the time parameter twice, and given too much weight to the time value.


Maximum supersaturation as shown, are the numbers that create M-values, or modified by GF, or used by VPM-B to compute theoretical extravascular microbubble growth. Its where your deco stops come from.


The graphs show the maximum supersaturation of the current controlling tissue. All other tissues will be underneath that value. If any one of those lower tissues has more gas than expected, it will either become the controlling tissue, or will become the controlling tissue when that tissue's half time becomes the dominate and controlling tissue.


Let me give you a simple example of this - saturation diving. Every tissue in a saturation dive is fully loaded, and the Schriener and Haldane equations handle this situation just fine too. That is a big version of the conditions you are concerned about Simon. Another example is multlevel diving, where the NDL time is reduced, or deco gets longer. Again these are all example of your concern, and all handled with the Schriener and Haldane equations.

Simon, You are arguing about a set of conditions, that are fully addressed already by existing gas tracking formula and deco.
 
Last edited:
The time and tissue saturation relation is inbuilt to the Schriener and Haldane equations - using a natural logarithm and called half time. These formula fully address any change in any tissue pressures.

A classic example of why it is a waste of time arguing with you. You have said exactly the same thing elsewhere and been told by experts why it is largely meaningless in the context the discussions about deep and shallow stop decompressions. These equations are the tools that allow any decompression modeller to predict tissue inert gas pressures (and supersaturation) at any point in time during a decompression, but their use in decompression planning is simply for that purpose. Decisions about how much supersaturation is allowed in various tissues, at what stage of the ascent, and for how long, are based around the assumptions / philosophies / rules (call them what you will) of the algorithm employed and are not determined by these equations. For example, even though "deep and shallow stop modellers" will use these equations (or something like them) to predict tissue supersaturation during decompression, deep and shallow stop approaches result in quite different patterns of supersaturation-time in fast and slow tissues, and these differences are thought to account for the differences in outcome (VGE and / or DCS) in the comparative studies.

Simon, You are arguing about a set of conditions, that are fully addressed already by existing gas tracking formula and deco.

Whatever Ross... not going there. And I am not going there because you have said exactly the same things on other threads / forums and the reasons your claims are frequently wrong, proved to the satisfaction of the virtually all readers and commentators, can be found on those threads. I'm sure you would welcome a break from defending your extraordinary attempts to rewrite DCS pathophysiology to suit your deep stops narrative on this thread by going back to this old territory, but I've had enough of it.

However, of relevance to this thread, if you wish to present your evidence that our view of the DCS pathophysiology is "clearly different to the concepts that other previous scientist and groups have put forward" then I would be very happy to discuss that.

Simon M
 
Last edited:
Back
Top